When I saw the word infographic on my strategic communications writing syllabus last semester, I was kind of dumbfounded at first. Info what? I immediately polled my friends and family to see if we were in the same uninformed boat. I soon realized that we all knew what an infographic looked like, we just didn’t know that these pictures, numbers, and words woven together were called infographics.
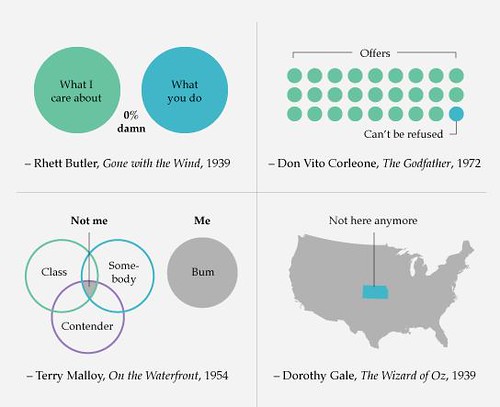
You can make an infographic out of anything. Let’s start with a simple one. How about famous movie quotes?
Infographics are a great way to share statistics and numerical values.

With a little precision, more complex statistics can also be displayed through various charts and graphs.

There is a method to the madness when visually representing information in an infographic. Just because you put graphics and information together on one page doesn’t mean you’ve created a vehicle that relays its content effectively.
So how do you relay this information to your audience successfully? How many times have you looked at an infographic that seems to have no beginning or end? Your eyes roam around the page looking for something, anything, to catch your attention and show you where to begin. This brings to mind the law of thirds in photography. What can you do to draw the eye of your audience? Visualization starts here.
The Law of Thirds: Example #1

Example #2

Example #3

Using a comparison layout is also an effective way to construct infographics.

Why is it more fun to read about pandas when the words are shaped like an actual panda? This is called a typography infographic.

Flow charts help engage your audience. They allow the viewer to choose their own path and come to their own conclusion. It’s like a choose your own adventure book– just a bit shorter.

These are only a few ideas to get you brainstorming for your next infographic project. The possibilities are literally endless! For more resources on infographic layouts:
- http://www.orphicpixel.com/10-types-of-infographics-to-perfectly-visualize-money-matters/
- http://www.bitrebels.com/design/8-types-of-infographics-use-when/
- http://neomam.com/infographics/the-8-types-of-infographic/
Infographics are a medium, so amazing content makes an amazing infographic. Emotional appeal, concrete visuals, credible data points, and in the end, amazing art work, all go into an excellent infographic. – Dave Snyder
Take Care,
Amanda


You must be logged in to post a comment.